
The WholesaleX Analytics Dashboard provides a quick overview of your wholesale (B2B) store performance. From a single screen, you can monitor key business metrics and track sales trends over time.
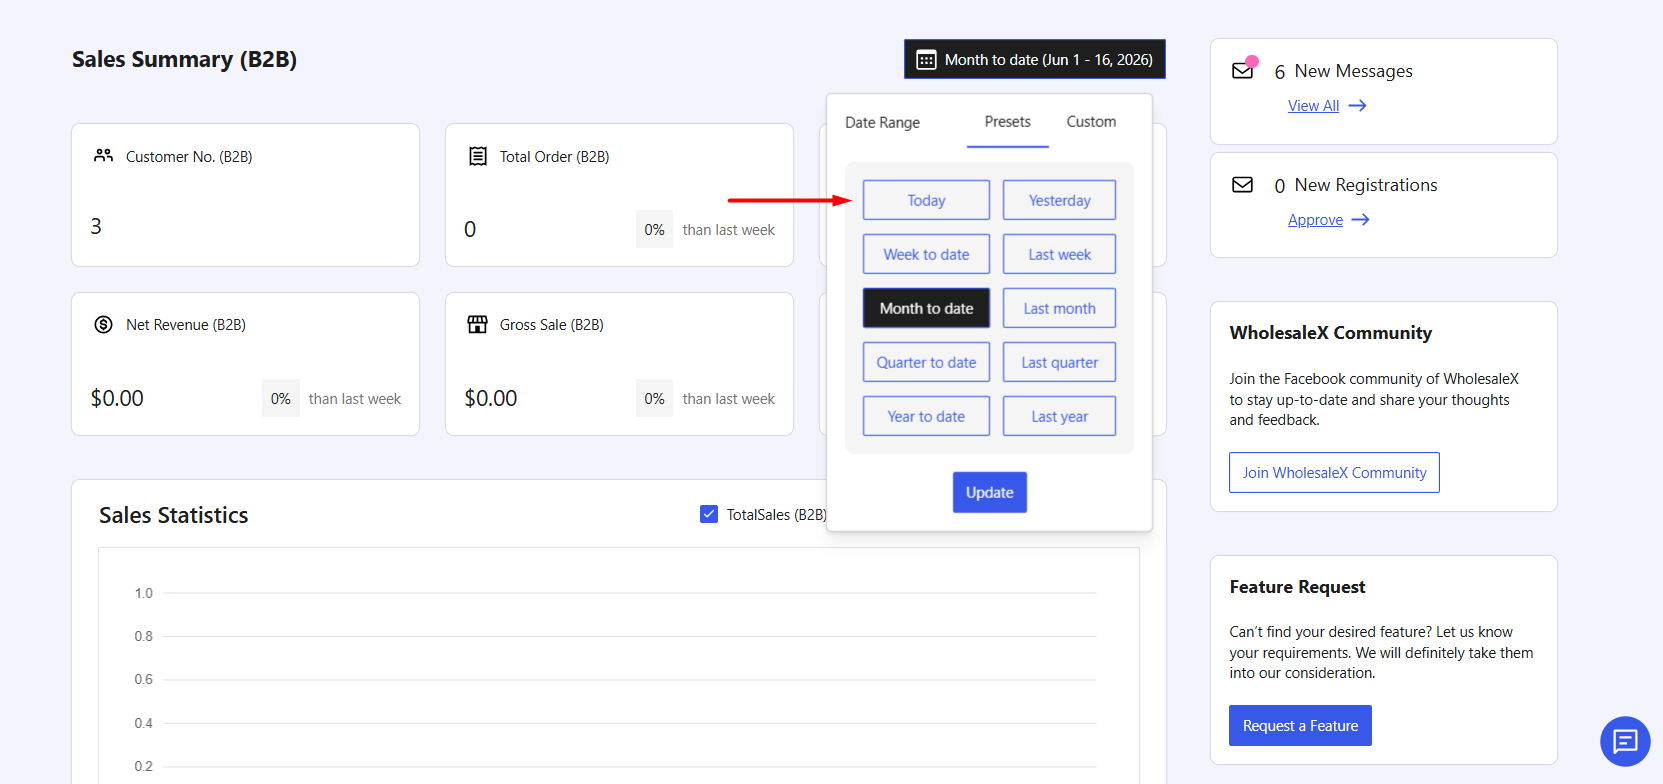
Sales Summary (B2B)
The dashboard includes the following B2B statistics:
- Customer No. (B2B) – Total number of wholesale customers.
- Total Orders (B2B) – Number of wholesale orders placed.
- Total Sales (B2B) – Total sales generated from wholesale customers.
- Net Revenue (B2B) – Revenue after deductions and adjustments.
- Gross Sales (B2B) – Total sales value before deductions.
- Average Order (B2B) – Average order value of wholesale purchases.
Sales Statistics
The Sales Statistics chart provides a visual representation of your wholesale sales performance over time.
You can track:
- Total Sales
- Net Revenue
- Gross Sales
Use the chart legend to show or hide specific metrics as needed.
Additional Insights
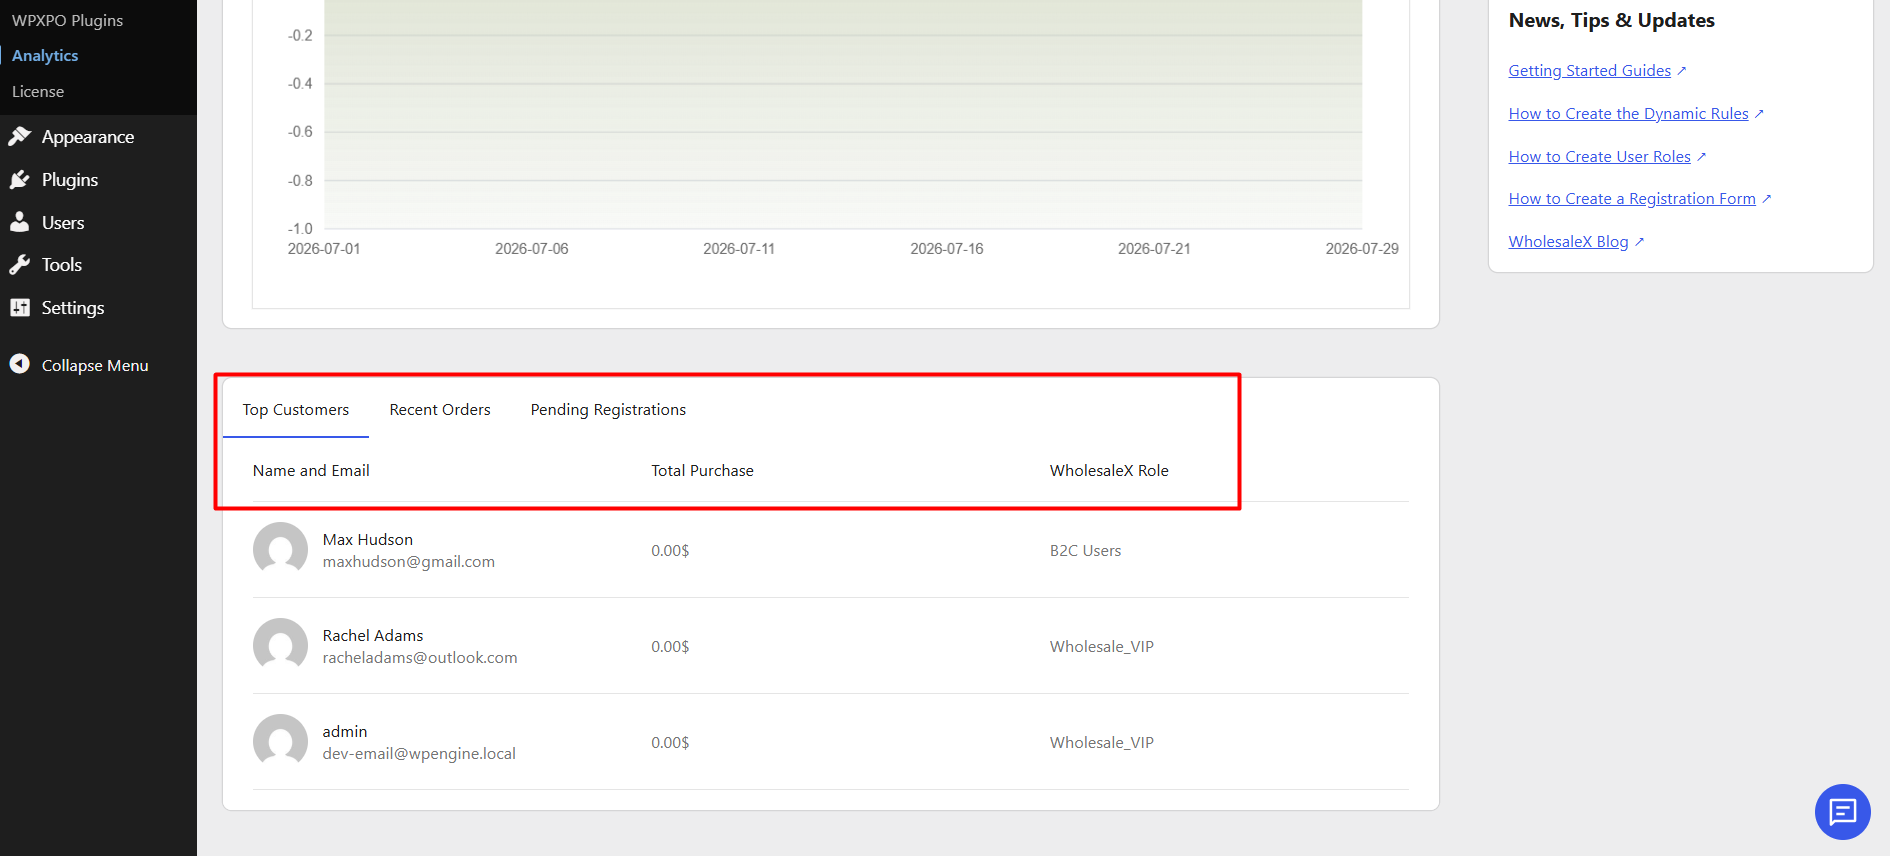
The dashboard also includes additional tabs for quick access to customer and store activity.
Top Customers
View your top wholesale customers, including their total purchases and assigned wholesale roles.
Recent Orders
View the latest wholesale orders placed in your store.
Pending Registrations
View wholesale registration requests that are awaiting approval.
Filtering Analytics
Click on the calendar icon at the top right of the analytics section. Easily filter the analytics data by selecting a preset or using the custom date selector.
Available presets include:
- Today
- Yesterday
- Week to Date
- Last Week
- Month to Date
- Last Month
- Quarter to Date
- Last Quarter
- Year to Date
- Last Year
You can also select a Custom date range to analyze data for a specific period.
After selecting a date range, click Update to refresh the dashboard statistics and charts.